Correlation methods
There are many correlation methods. Three widely used correlation types are:
- Pearson correlation evaluates the degree of linear relationship between normally distributed variables, and it is called the Pearson correlation coefficient, r.
- Spearman rank correlation identifies the strength of the relationship between two ranked variables. It is a non-parametric measure of rank correlation and called Spearman's correlation rank, rho.
- Kendall rank correlation assesses the level of relationship between two variables and called Kendall's tau, τ. It is also a non-parametric rank correlation measure.
Let's see an example. You may use any quantitative data for this test. I use randomly generated sample data in this post.
set.seed(12)
a <- runif(100)*5
b <- sqrt(a)+runif(50)
c <- sqrt(a)+sin(a)
d <- c+rnorm(100)

data <- data.frame(a=a, b=b,c=c,d=d)
head(data)
          a        b         c           d
1 0.3468046 1.071878 0.9287955  0.29495733
2 4.0888760 2.863152 1.2102647 -0.06078913
3 4.7131087 2.626115 1.1709698  0.78701939
4 1.3469094 2.021082 2.1356061  2.65236189
5 0.8467406 1.596287 1.6693104  1.49134184
6 0.1694781 1.139260 0.5803452  0.58460319
To check the correlation of variables, we use cor() function in R.
cor(a,b)
[1] 0.8827953
cor(a,d)
[1] -0.09292306
cor(b,b)
[1] 1
We may check all data frame variables too. Output comes in a below matrix.
> cor(data)
            a            b            c           d
a  1.00000000  0.857666325 -0.182334309 -0.09292306
b  0.85766633  1.000000000  0.005663791 -0.05769570
c -0.18233431  0.005663791  1.000000000  0.48158862
d -0.09292306 -0.057695703  0.481588625  1.00000000
Correlation method can be specified in method argument of cor() function.
cor(a,b, method="pearson")
[1] 0.8576663
cor(a,b, method="kendall")
[1] 0.6824242
cor(a,b, method="spearman")
[1] 0.8672907
Testing correlation
To check the correlation statistics and probability value (p-value) for two variables, we can use cor.test() function.cor.test(a, b)
Pearson's product-moment correlation
data: a and b
t = 16.512, df = 98, p-value < 2.2e-16
alternative hypothesis: true correlation is not equal to 0
95 percent confidence interval:
0.7952103 0.9021133
sample estimates:
cor
0.8576663
cor.test(a, b, method="spearman")

 Spearman's rank correlation rho

data:  a and b
S = 22116, p-value < 2.2e-16
alternative hypothesis: true rho is not equal to 0
sample estimates:
      rho
0.8672907

cor.test(a, b, method="kendall")

 Kendall's rank correlation tau

data:  a and b
z = 10.06, p-value < 2.2e-16
alternative hypothesis: true tau is not equal to 0
sample estimates:
      tau
0.6824242
Plotting correlation matrix
There are many ways to plot a correlation matrix data. Here, I use levelplot() function of lattice package.
library(lattice)
cor_data <- cor(data)
print(cor_data)
            a            b            c           d
a  1.00000000  0.857666325 -0.182334309 -0.09292306
b  0.85766633  1.000000000  0.005663791 -0.05769570
c -0.18233431  0.005663791  1.000000000  0.48158862
d -0.09292306 -0.057695703  0.481588625  1.00000000
levelplot(cor_data)
![[block]](https://blogger.googleusercontent.com/img/b/R29vZ2xl/AVvXsEi50Lo4Gj4InIcZecn2XzM01lfkXBTC7vQwweJvaCEoZ3xGq1iL_M3EPMbm3VB1pU_EsOV-RRGwV7ulbbixTL7lOtk_x0-gBgsMAvITEXfTatiQ7tK5bUth0VjyfRDDeNvlPxxb3pJAT5g/s1600/cor_levelplot.png)
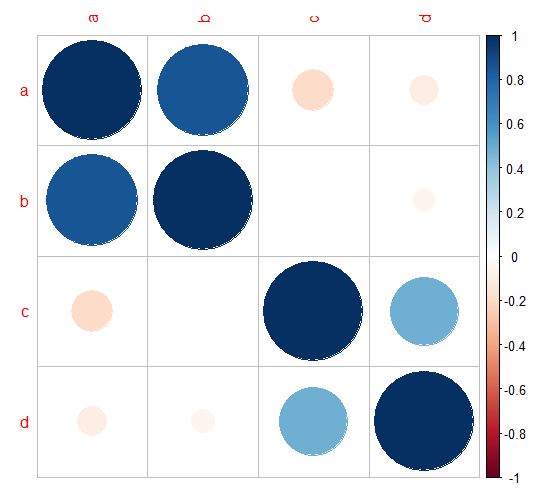
Plotting with corrplot
Correlation data can also be plotted with a corrplot library.
> library(corrplot)
> corrplot(cor_data)or
> corrplot(cor_data,method="circle")
A method can be changed into "square", "ellipse", "number", "pie", "shade", and "color" type.
In this post, a brief explanation of correlation and its usage in R is explained.
No comments:
Post a Comment