K-means clustering is primarily used for grouping similar data points together. In this tutorial, I'll share my approach how to use the KMeans to detect outlier detection in data. The tutorial covers:
Introduction to K-Means algorithm
K-means is a clustering algorithm that partitions data into 'k' clusters. It starts by randomly selecting 'k' centroids, then iteratively assigns each data point to the nearest centroid and recalculates the centroids based on the mean of the points assigned to each cluster. This process continues until the centroids stabilize or a specified number of iterations is reached. K-means aims to minimize the within-cluster sum of squared distances, effectively grouping similar data points together. The result is 'k' clusters with centroids representing their respective centers, allowing for data segmentation based on similarity.
Approach for anomaly detection
In this tutorial, we fit the K-means algorithm to the data and obtain the cluster labels. However, setting n_clusters=1 means that only one cluster is created, effectively finding the centroid of the data. Then, the distance of each point to this centroid is calculated to identify outliers.
Using K-means for anomaly detection by setting n_clusters=1 and considering points far from the centroid as outliers can work in some cases, especially when you're dealing with data that forms well-defined clusters. However, it's not a robust method for anomaly detection in general.
Note that this is only the approach I wanted to try it.
Preparing the data
We'll start by loading the necessary libraries for this tutorial.
from sklearn.datasets import make_blobs
from sklearn.cluster import KMeans
import numpy as np
import matplotlib.pyplot as plt
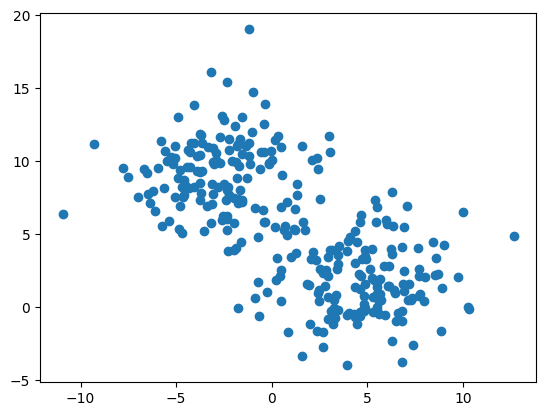
We'll use randomly generated data by using make_blob() function of Scikit-learn.
# Generate synthetic data with three clusters
X, _ = make_blobs(n_samples=300, centers=2, cluster_std=2.6, random_state=42)
# Visualize the data
plt.scatter(X[:,0], X[:,1])
plt.show()
Anomaly detection with KMeans
We instantiate KMeans class of Scikit-learn and fit to the data with n_clusters=1, effectively finding one cluster.
# Fit k-means to the data
kmeans = KMeans(n_clusters=1, random_state=42)
kmeans.fit(X)
Next, we predict cluster labels using predict() method.
# Predict cluster labels
labels = kmeans.predict(X)
The distances of each data point to the cluster center are calculated using transform() method.
# Calculate distances of each point to the cluster center
cluster_distances = kmeans.transform(X)
Euclidean distances from each point to the cluster center are calculated and the top n_outlier points with the longest distances are identified as outliers.
# Number of outliers to identify
n_outlier = 4
# Calculate Euclidean distances and find the outliers
euclidean_distances = np.linalg.norm(cluster_distances, axis=1)
outlier_indices = np.argsort(euclidean_distances)[-n_outlier:]
Data points are plotted with their cluster labels. Outliers are
highlighted in red, and the cluster center is marked with a black cross.
# Plot the data points and cluster center
plt.scatter(X[:, 0], X[:, 1], c=labels, alpha=0.7)
# Highlight outliers with a different color
plt.scatter(X[outlier_indices, 0], X[outlier_indices, 1], marker='x',
s=70, c='red', label='Anomalies')
plt.scatter(kmeans.cluster_centers_[:, 0], kmeans.cluster_centers_[:, 1],
marker='o', c='blue', label='Cluster Center')
plt.title('K-Means Anomaly Detection')
plt.legend()
plt.show()
In this tutorial, we learned how to detect anomalies using Kmeans and distance calculation.
While K-means can be a simple and computationally efficient method for
clustering, it might not always be the best choice for anomaly
detection. It's essential to consider the characteristics of your data
and explore other methods that are specifically designed for anomaly
detection to ensure robust and accurate results.
Source code listing
from sklearn.datasets import make_blobs
from sklearn.cluster import KMeans
import numpy as np
import matplotlib.pyplot as plt
# Generate synthetic data with three clusters
X, _ = make_blobs(n_samples=300, centers=2, cluster_std=2.6, random_state=42)
# Visualize the data
plt.scatter(X[:,0], X[:,1])
plt.show()
# Fit k-means to the data
kmeans = KMeans(n_clusters=1, random_state=42)
kmeans.fit(X)
# Predict cluster labels
labels = kmeans.predict(X)
# Calculate distances of each point to the cluster center
cluster_distances = kmeans.transform(X)
# Number of outliers to identify
n_outlier = 4
# Calculate Euclidean distances and find the outliers
euclidean_distances = np.linalg.norm(cluster_distances, axis=1)
outlier_indices = np.argsort(euclidean_distances)[-n_outlier:]
# Plot the data points and cluster center
plt.scatter(X[:, 0], X[:, 1], c=labels, alpha=0.7)
# Highlight outliers with a different color
plt.scatter(X[outlier_indices, 0], X[outlier_indices, 1], marker='x',
s=70, c='red', label='Anomalies')
plt.scatter(kmeans.cluster_centers_[:, 0], kmeans.cluster_centers_[:, 1],
marker='o', c='blue', label='Cluster Center')
plt.title('K-Means Anomaly Detection')
plt.legend()
plt.show()


Hi, thanks for sharing!! I have a question why do we need to use K-mean when k=1, can we simply use average or median instead?
ReplyDeleteYou are welcome! Here, k=1 means that single cluster for given dataset. We'll find all outliers around one center.
Delete