Image contour detection is a technique used to identify and extract the boundaries of objects or regions in an image. The process involves detecting edges in a grayscale image and grouping them to form closed contours. Contours are widely used in tasks such as object recognition, shape analysis, and image segmentation.
In this tutorial, you'll briefly learn how to find and draw contours in image by using OpenCV functions in Python. The tutorial covers:
- Contour detection
- Extracting contours
- Source code listing
We'll start by loading the required libraries.
import cv2
from matplotlib import pyplot as plt
import numpy as np
In this tutorial, we need an image file to apply contour detection. The following code shows how to load an image and display it in a plot. Here, you have to change your file path. Since I use Matplotlib library to display images, the image color order needs to be adjusted into the Matplotlib type.
file = "/Users/user/Desktop/image.jpg" # Load an image
img = cv2.imread(file)
# OpenCV to Matplotlib color adjustment
img = cv2.cvtColor(img, cv2.COLOR_BGR2RGB) plt.imshow(img)
plt.show() # Convert the image to grayscale
gray = cv2.cvtColor(img, cv2.COLOR_BGR2GRAY)
# Apply threshold to create a binary image
thresh = cv2.adaptiveThreshold(
gray, 255, cv2.ADAPTIVE_THRESH_GAUSSIAN_C, cv2.THRESH_BINARY_INV, 21, 5)
# Find contours in the binary image
contours, _ = cv2.findContours(thresh, cv2.RETR_TREE, cv2.CHAIN_APPROX_SIMPLE)
detected_contours = img.copy() # Draw the contours on the copy of original image cv2.drawContours(detected_contours, contours, -1, (0, 255, 0), -1)
plt.imshow(detected_contours) plt.title('Detected contours') plt.show()
After detecting the contours, we can highlight or extract contours in image. The following shows how to highlight contours with color.
# Find contours contours, _ = cv2.findContours( thresh, cv2.RETR_EXTERNAL, cv2.CHAIN_APPROX_SIMPLE) # Create a mask image highlight = np.ones_like(img) # Draw the contours on the background cv2.drawContours(highlight, contours, -1, (0, 200, 175), cv2.FILLED)
# display the image plt.imshow(highlight) plt.title('Highlight contour with color') plt.show()
It is also possible to keep original colors of detected contours in image. In below code, we extract contours with their original color. Here is an example of extracting contours with their original colors.
# Create a mask image with the same size as the original image
mask = np.zeros_like(img)
# Draw filled contours on the mask image
cv2.drawContours(mask, contours, -1, (255, 255, 255), cv2.FILLED)
# Extract the foreground pixels from the original image using the mask
foreground = cv2.bitwise_and(img, mask) # Show the edges of image plt.imshow(foreground) plt.title('Extract contours') plt.show()
The following is the code of visualizing the output of all contour images in above methods.
# Collect all methods contours = {"Original": img, "Detected contours": detected_contours,
"Color contours": highlight, "Extract contours": foreground}
# display in a graph
plt.subplots_adjust(wspace=.2, hspace=.2)
plt.tight_layout()
for i, (key, value) in enumerate(contours.items()):
plt.subplot(2, 2, i + 1)
plt.tick_params(labelbottom=False)
plt.tick_params(labelleft=False)
plt.title("{}".format(key))
plt.imshow(value)
plt.show() 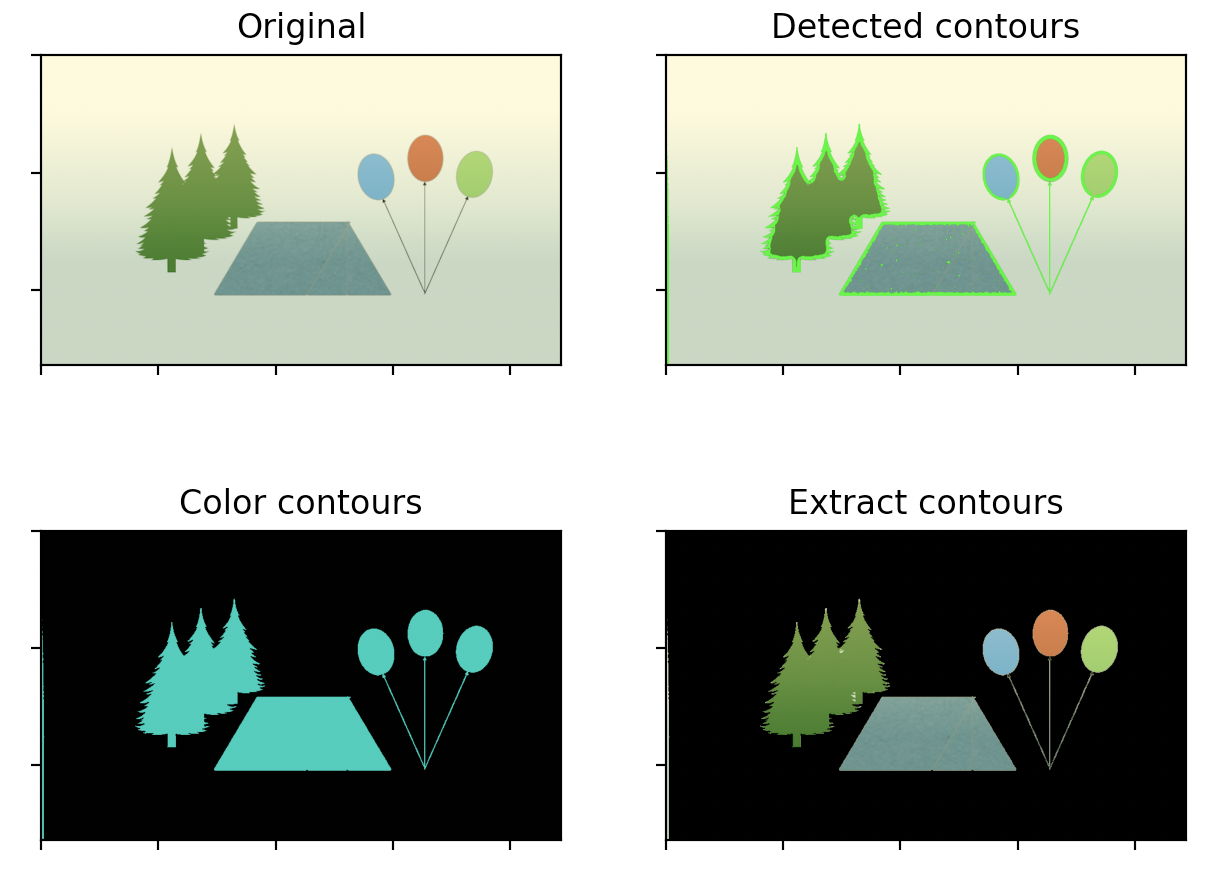
In this tutorial, we've briefly learned how to detect contours on image and extract them with OpenCV functions in Python. The full source code is listed below.
import cv2
from matplotlib import pyplot as pltimport numpy as np file = "/Users/user/Desktop/image.jpg"
# Load an image
img = cv2.imread(file)

# OpenCV to Matplotlib color adjustment
img = cv2.cvtColor(img, cv2.COLOR_BGR2RGB)
plt.imshow(img)
plt.show() # Convert the image to grayscale gray = cv2.cvtColor(img, cv2.COLOR_BGR2GRAY) # Apply threshold to create a binary image thresh = cv2.adaptiveThreshold( gray, 255, cv2.ADAPTIVE_THRESH_GAUSSIAN_C, cv2.THRESH_BINARY_INV, 21, 5) # Find contours in the binary image contours, _ = cv2.findContours(thresh, cv2.RETR_TREE, cv2.CHAIN_APPROX_SIMPLE) detected_contours = img.copy()
# Draw the contours on the copy of original image
cv2.drawContours(detected_contours, contours, -1, (0, 255, 0), -1)
plt.imshow(detected_contours)
plt.title('Detected contours')
plt.show()
# Find contours
contours, _ = cv2.findContours(
    thresh, cv2.RETR_EXTERNAL, cv2.CHAIN_APPROX_SIMPLE)

# Create a mask image
highlight = np.ones_like(img)

# Draw the contours on the background
cv2.drawContours(highlight, contours, -1, (0, 200, 175), cv2.FILLED)
# display the image
plt.imshow(highlight)
plt.title('Highlight contour with color')
plt.show()
# Create a mask image with the same size as the original image
mask = np.zeros_like(img)

# Draw filled contours on the mask image
cv2.drawContours(mask, contours, -1, (255, 255, 255), cv2.FILLED)

# Extract the foreground pixels from the original image using the mask
foreground = cv2.bitwise_and(img, mask)
# Show the edges of image plt.imshow(foreground) plt.title('Extract contours') plt.show()
# Collect all methods
contours = {"Original": img, "Detected contours": detected_contours,
            "Color contours": highlight, "Extract contours": foreground}

# display in a graph
plt.subplots_adjust(wspace=.2, hspace=.2)
plt.tight_layout()

for i, (key, value) in enumerate(contours.items()):
    plt.subplot(2, 2, i + 1)
    plt.tick_params(labelbottom=False)
    plt.tick_params(labelleft=False)
    plt.title("{}".format(key))
    plt.imshow(value)

plt.show()
No comments:
Post a Comment