FbProphet, an open source software released by Facebook, provides a procedure for forecasting time series data based on an additive model. In this tutorial, I'll briefly explain how to forecast time series data by using FbProphet API in Python.
The tutorial covers:
- Preparing time series data
- Defining the model and forecasting
- Performance evaluation
- Source code listing
Let's start by loading the required packages for this tutorial.
import yfinance as yf
import pandas as pd

from fbprophet import Prophet
from fbprophet import plot
from fbprophet.diagnostics import cross_validation, performance_metrics
You can install 'yfinance' and 'fbprophet' packages by using pip.
pip install yfinance pip install fbprophet
Preparing time series data
Time series data is a sequence of data points indexed in time order. We can get this type of data by using Yahoo finance API. In this tutorial, we'll use Facebook historical stock price data to analyze. Below code shows how to download and prepare it for use.
tickerSymbol = "FB"
tickerData = yf.Ticker(tickerSymbol)
tickerDf = tickerData.history(start="2015-01-01", end="2020-01-07")

tickerDf.head()
Open High Low ... Volume Dividends Stock Splits
Date ...
2014-12-31 79.540001 79.800003 77.860001 ... 19935400 0 0
2015-01-02 78.580002 78.930000 77.699997 ... 18177500 0 0
2015-01-05 77.980003 79.250000 76.860001 ... 26452200 0 0
2015-01-06 77.230003 77.589996 75.360001 ... 27399300 0 0
2015-01-07 76.760002 77.360001 75.820000 ... 22045300 0 0 The prophet model requires data frame input data with columns 'ds' and 'y'. 'ds' is time stamp data and 'y' numeric data. We'll create input data as shown below.
df = pd.DataFrame(columns=["ds", "y"])

df["ds"] = tickerDf.index
tickerDf = tickerDf.reset_index()
df["y"] =  tickerDf['Close']
df.head() ds y
0 2014-12-31 78.019997
1 2015-01-02 78.449997
2 2015-01-05 77.190002
3 2015-01-06 76.150002
4 2015-01-07 76.150002
Defining the model and forecasting
We define model by using Prophet class and fit the model on 'df' input data.
model = Prophet()
model.fit(df)
Prediction days can be set by using make_future_dataframe() method of the model.
future = model.make_future_dataframe(periods=180) Now, we can predict the future period with trained model.
forecast = model.predict(future)
forecast.head()
ds trend ... multiplicative_terms_upper yhat
0 2014-12-31 77.918570 ... 0.0 70.933857
1 2015-01-02 77.967258 ... 0.0 70.955889
2 2015-01-05 78.040291 ... 0.0 71.149336
3 2015-01-06 78.064635 ... 0.0 71.453739
4 2015-01-07 78.088979 ... 0.0 71.712704 FbProphet provides 'plot' method to visualize forecast data. We can easily plot the forecast data.
plot.plot(model, forecast)

To visualize components we use plot_components method.
plot.plot_components(model, forecast) 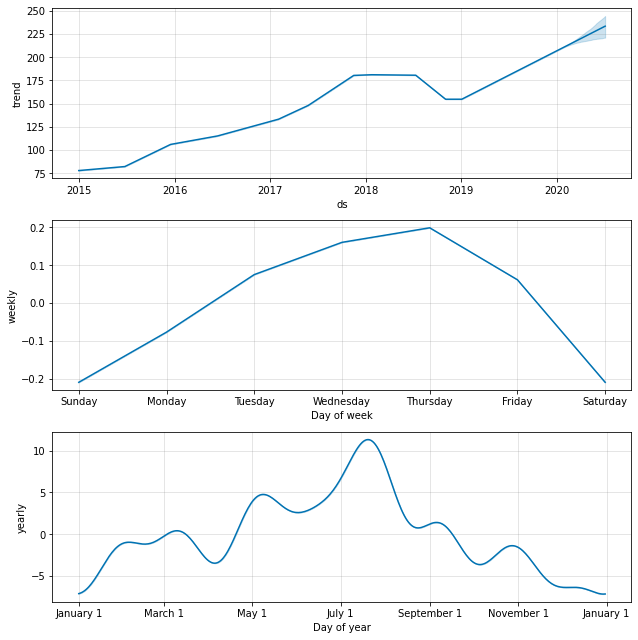
We can check prediction performance by using cross_validation() method. Defined cutoffs in a historic data will be used to measure prediction error rates. We apply cross validation and extract the statistics of the prediction.
df_cv = cross_validation(model, initial='360 days', period='180 days', horizon = '365 days')
df_p = performance_metrics(df_cv, rolling_window=0.1)
df_p.head() horizon mse rmse mae mape mdape coverage
0 36 days 168.357384 12.975260 9.822421 0.064845 0.054113 0.301136
1 37 days 179.032791 13.380314 10.178312 0.067101 0.056766 0.289773
2 38 days 188.598973 13.733134 10.482477 0.069057 0.057384 0.272727
3 39 days 193.924787 13.925688 10.671479 0.070444 0.058132 0.264773
4 40 days 199.392740 14.120649 10.897853 0.071910 0.059398 0.250000
plot.plot_cross_validation_metric(df_cv, metric='mape') 
In
this tutorial, we've briefly learned how to forecast time series data by using FbProphet API in Python. The full source
code is listed below.
Source code listing
import yfinance as yf
import pandas as pd

from fbprophet import Prophet
from fbprophet import plot
from fbprophet.diagnostics import cross_validation, performance_metrics
tickerSymbol = "FB"
tickerData = yf.Ticker(tickerSymbol)
tickerDf = tickerData.history(start="2015-01-01", end="2020-01-07")
tickerDf.head()
df = pd.DataFrame(columns=["ds", "y"])
df["ds"] = tickerDf.index
tickerDf = tickerDf.reset_index()
df["y"] = tickerDf['Close']
df.head()
model = Prophet()
model.fit(df)
future = model.make_future_dataframe(periods=180)
future.head()
forecast = model.predict(future)
forecast.head()
plot.plot(model, forecast)
plot.plot_components(model, forecast)
df_cv = cross_validation(model, initial='360 days', period='180 days', horizon = '365 days')
df_p = performance_metrics(df_cv, rolling_window=0.1)
df_p.head()
plot.plot_cross_validation_metric(df_cv, metric='mape')
References:
Buen aporte estimado. Mucha gracias!
ReplyDelete